

If you’ve felt like stock prices were a little more volatile in 2022 than in recent years, your “spidey senses” are right on the money.
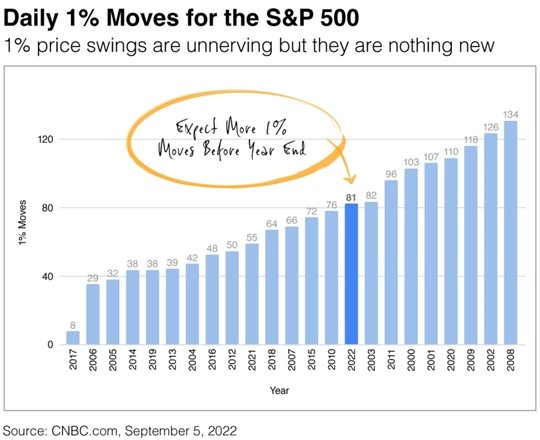
The S&P 500 has posted 81 daily moves of at least 1% through August. Of those moves, 39 have been to the upside and 42 to the downside.
In the chart below, I highlighted 2022 to show how it compares to other years since 2000. Since the daily report was compiled, stocks have seen a few more 1% swings. With more than 70 trading days left in the year, my hunch is we could see more.
What’s fueling the volatility? The Fed, largely. Its monetary policy of raising interest rates to slow inflation without triggering a recession has created a lot of uncertainty.
Price swings are unnerving, but as the chart shows, they are nothing new. What’s most important is focusing on your goals and not paying too much attention to Wall Street’s daily ups and downs.